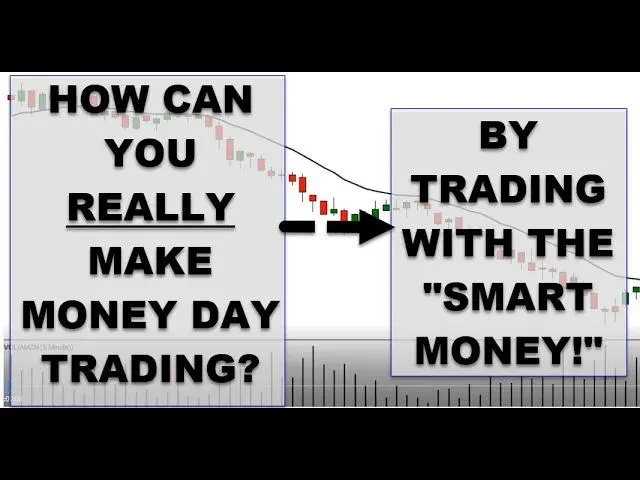
Make Money Day Trading
Hello, my friend, and welcome to this tutorial on Make Money Day Trading. In this post, we will answer the infamous question "Can you make money day trading Forex and other markets?" While most people do not, if you stick to some fundamental technical analysis using pure price action and volume patterns on your stock charts, you'll lay the foundation for potentially making the kinds of returns you'd like. Enjoy!
Can you truly profit from day trading? The answer is yes, but the reality is that most people don't. It's crucial to acknowledge that while it's possible, not everyone succeeds. To improve your chances and place yourself in the top percentage of traders, you need an edge, and one effective element is volume.
In this straightforward presentation, I'll emphasize the significance of keeping your trading approach simple yet effective. Information overload is a common pitfall, and despite the availability of numerous tools and indicators, more complexity doesn't necessarily translate to more profit. As Einstein suggested, keep things as simple as possible but no simpler.
Let's Dive into the Foundation of Price Action and Volume Trading - Make Money Day Trading
Now, let's delve into the basics of using price and volume. I employ a 15 EMA (Exponential Moving Average) here, but your choice may vary. The key is to observe the relationship between price and the moving average. When the price is below the moving average, I consider it a relative strength indication rather than a trend indicator.
To enhance our analysis, we look at volume, a critical factor indicating the strength of a move. Volume represents market participation, revealing demand and supply dynamics. In a downtrend, we want to see higher volume during downward moves, signifying strong market participation. Conversely, in an uptrend, volume should surge during upward moves.
Examining the Relationship between Price, Moving Averages, and Volume - Make Money Day Trading
It's essential to avoid fixating on each individual volume bar; instead, focus on their relative differences. For example, a volume bar that is twice the height of the previous one is significant. We want to gauge the overall strength of the move rather than scrutinizing each bar.
Examining the interplay of price, moving average, and volume helps us identify potential retraces and reversals. For a downtrend continuation, we seek weak retraces with low volume, signifying continued strength in the downward move. Conversely, a reversal may be indicated by a strong retrace with higher volume, signaling a potential shift in market sentiment.
Wrapping Up!
Understanding these basic patterns—strength down, weakness up—forms the foundation. While volume is not a pinpoint-accurate tool, its relative nature aids in decision-making. It serves as a statistical indicator, revealing market participation levels and helping identify potential trade setups.
Free Offer!
And finally, I am offering one of my favorite trade strategies called the Rubber Band Trade. Absolutely free. And I want you to go and make some money. Try before you buy, or well, actually try and never buy because there’s no charge for this trade at all. And I’ll give you the setups, the exits, all the rules for it. It’s an objective rule-based method based on price pattern action that I don’t think anyone else teaches.
I’ve never seen anything else teach this particular price structure. So go get that by clicking on the green icon in the top right-hand corner of the video there, or by clicking on the green button below, and that’ll take you to a page where you can opt-in, get the video for the rubber band trade strategy, along with some other great free tutorials, one of my little mini-courses, absolutely free, courtesy of Barry Burns here at Top Dog Trading.
Try It For Yourself
Lorem Ipsum is simply dummy text of the printing and typesetting industry. Lorem Ipsum has been the industry's standard.
© Copyright 2024. Top Dog Trading. All rights reserved.


